Correcting FSR400 implementation
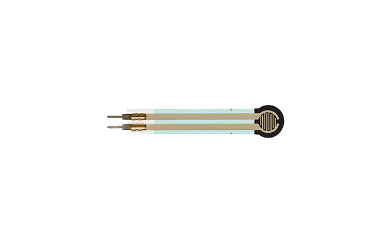
In this post we will analyze the electrical instrumentation regarding the implementation of the FSR400 force sensors. The design choices in the instrumentation affect the resolution of the measured force and the interval of forces with high resolution. We demonstrate a method to visualize the resolution obtained for different design choices, and ultimately argue that the previous implemented system might not be optimal. We also found that the choices for FSR400 (Figure 1) and FSR406 (Figure 2) should not be the same.
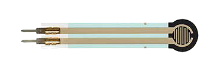 Figure 1: FSR400
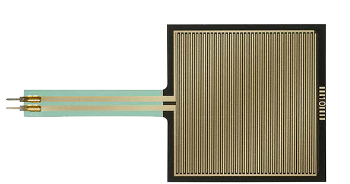 Figure 2: FSR406
Correlation between force and sensor resistance
The correlation between force and sensor resistance is given by the manufacturer is presented in Figure 3.
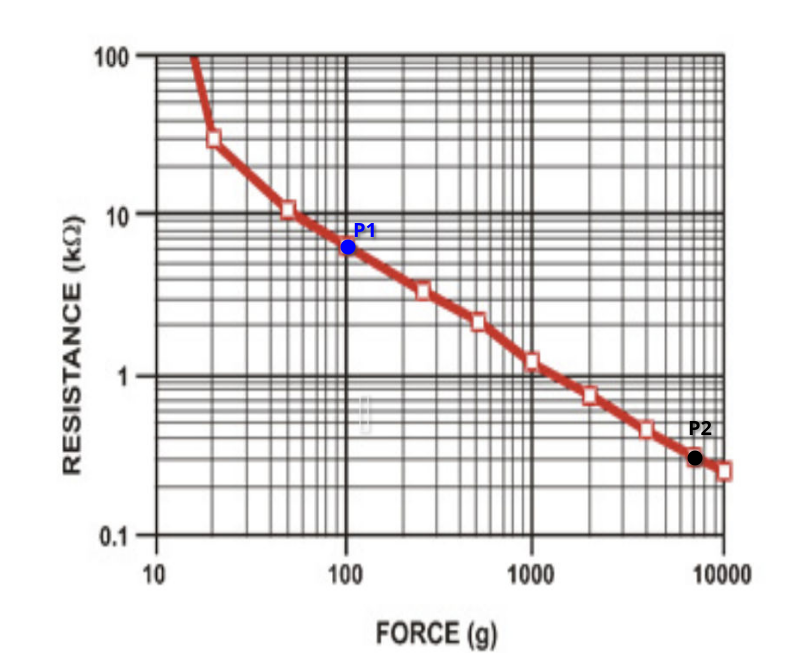 Figure 3: The FSR resistance given force applied. Both scales are logarithmic of base 10
The correlation in Figure 3 can be modelled with the following equation:
\[\begin{equation} \begin{split} \log_{10}(R_{FSR}) &= m\log_{10}(F)+b \\ R_{FSR} &= 10^{m\log_{10}(F) + b} \\ R_{FSR} &= (10^{\log_{10}(F)})^m.10^b \\ R_{FSR} &= 10^bF^m \\ \end{split} \end{equation}\]Utilizing the points \(P_1=(2;0.796)\) and \(P_2=(3.845;-0.669)\), we obtain the linear coefficients \(m=-0.8103\) and \(b=2.466\).
Electric Circuit
As proposed by the manufacturers, we need a resistance \(R\) in a voltage divider (Figure 4).
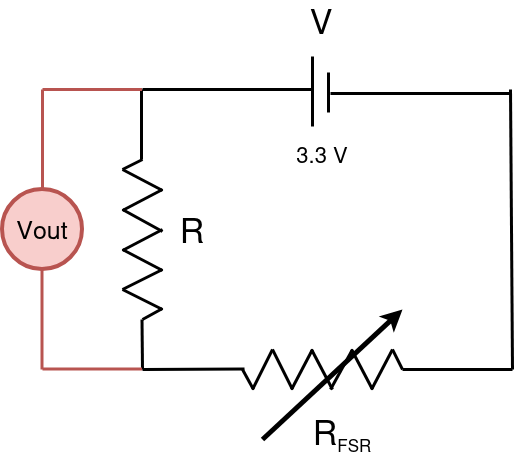 Figure 4: Electrical circuit currently implemented to measure the force applied in FSR
The resistance’s value choice affects the relation between the measured voltage for a given force input. Given the exponential relationship (Figure 3), we need to select \(R\) given a predefined input voltage and force range to maximize the measurement’s overall resolution.
Both FSR400 and FSR406 will have an input voltage of \(3.3\) V, however limits on force measurement are different. FSR400 has a range from \(0-20\) N while FSR100 has a range of \(0-100\) N.
We can calculate the FSR resistance \(R_{FSR}\) given the measured voltage \(V_{out}\) through the voltage splitter formula:
\[\begin{equation} \begin{split} V_{out} &= V_{in} \frac{R}{R + R_{FSR}} \\ R_{FSR} &= R(\frac{V{in} - V{out}}{V{in}}) \end{split} \end{equation}\]Replacing \(R_{FSR}\) with the equation of the previous section, we get:
\[\begin{equation} \begin{split} 10^bF^m &= R(\frac{V{in} - V{out}}{V{in}}) \\ F &= (\frac{R}{10^b}(\frac{V{in} - V{out}}{V{out}}))^{(1/m)} \\ \end{split} \end{equation}\]We plot the force \(F\) given \(V_{out}\) in Figure 5 for FSR400 (\(0-20\) N).
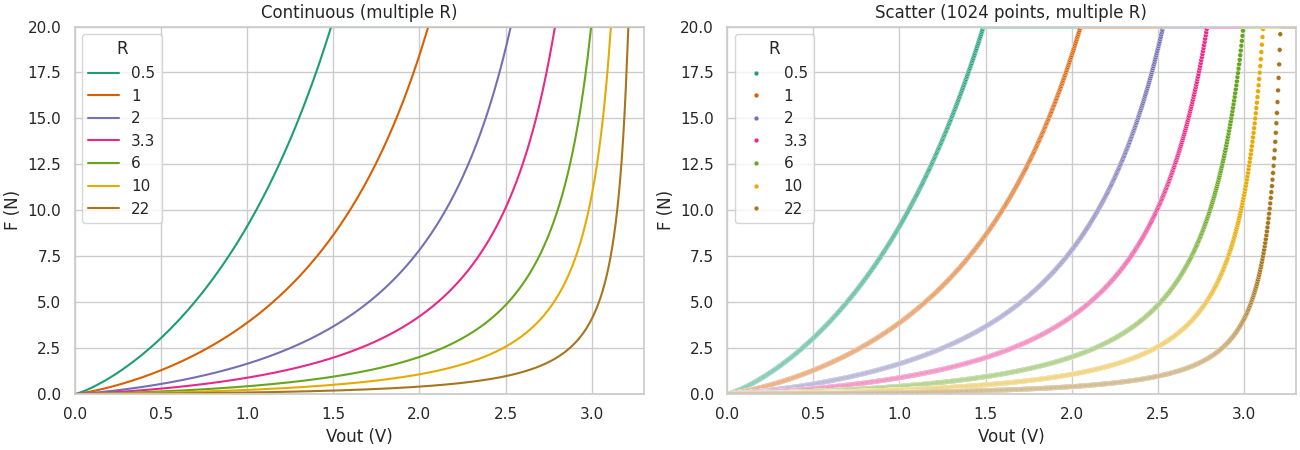 Figure 5: Force applied given the measured output voltage. The left image shows the physical law. The right image shows the 1024 discretized values encoded by the 32-bit analog reader.
The left image shows the expected behavior of the force measured given an output voltage with resistance value. The right image shows the same physical correlation, but discretized to visualize the limitations of the microcontroller’s 32-bit encoding.
The current implementation selected \(22\) kΩ resistance in order to maximize the occupied voltage range, given the required force range. However, this design choice fails to considered the exponential relationship between the two variables. The outcome is that almost \(90\)% of the voltage range encodes the lower \(10\)% of the force range, and vice-versa.
Lower \(R\)’s value substantially diminishes this behavior. However, the trade-off is that we also lower useful range of voltage values. This suggests that there might be an optimal value for \(R\).
Analyzing the plots in Figure 5, we suggest \(3.3\) kΩ. This lower resistance mitigates severely the unbalanced resolution throughout the force spectrum (approaching the correlation closer to a linear mapping), while giving up a small portion of the voltage range (\(16\)%).
We also must mention that the value of \(R\) has implication of the current entering the analog reader of our micro-controller Teensy 4.0. In the documentation we saw that it can handle \(250\) mA across the combined 10 pins. If we limit $25$ mA on each pin, that means that we need a resistance of $132$ Ω. That means that the values of resistances proposed are safe to use and should all be considered.
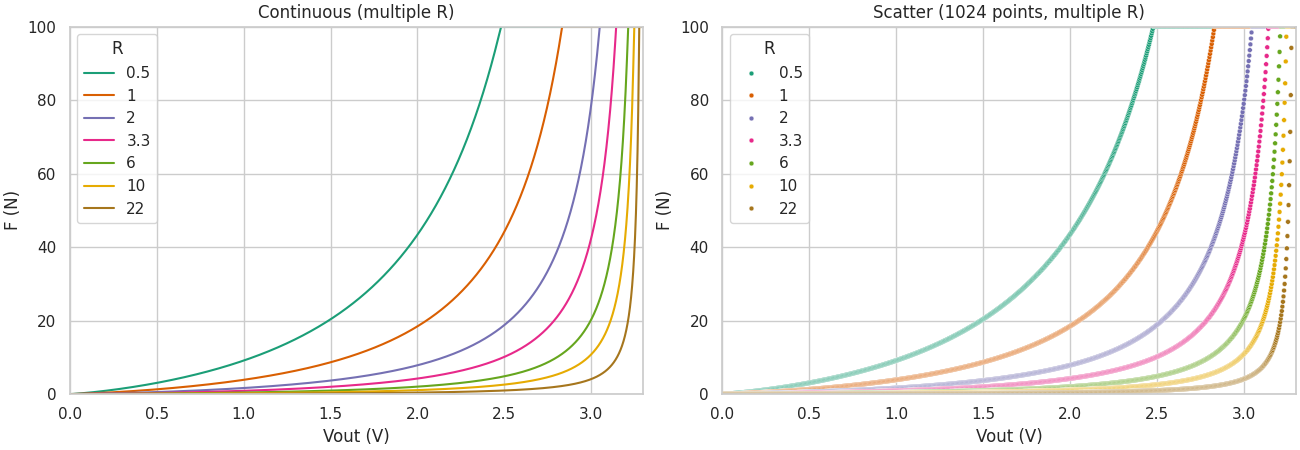 Figure 6: Force applied given the measured output voltage. The left image shows the physical law. The right image shows the 1024 discretized values encoded by the 32-bit analog reader.
For the FSR406, the plots are the same but for a range of \(0-100\) N, giving a different answer. For this sensor, it seems more fitting \(1\) kΩ, for the same reasons.
Conclusions
In this post, we derived the physical law that correlates force applied on a FSR sensor and the voltage measured by the microcontroller. We found out that utilizing the same resistance values for both FSR400 and FS406 is limiting, and utilizing \(22\) kΩ has unforeseen consequences on the measurement’s resolution. We propose \(3.3\) kΩ for FSR400 and \(1\) kΩ for FSR406.